Predictive Maintenance
with 4-Level Analytics
ROSSMA is more than vibration sensors. It is 4 levels of intelligent analytics: from basic telemetry to ML-powered RUL prediction. 21 diagnostic widgets, virtual flow meter (VFM), ASPO and gas slug detection, Decision Fusion for pipelines. Oil & gas, industry, energy
Problems Solved by Predictive Analytics
Oil & gas, industry, and energy lose millions to emergency repairs
Unplanned Downtime
ESP, pump, or compressor failure stops production. Every hour of downtime means direct losses. Emergency repair costs 3-5x more than planned maintenance.
Schedule-Based, Not Condition-Based
Planned maintenance follows a calendar, not actual wear. Result: either overspending (early replacement) or failure (late replacement).
ASPO, Gas Slugs, Sand Production
Paraffin deposits, gas at pump intake, and mechanical impurities are the main causes of premature downhole equipment failure. Without analytics, discovered only at breakdown.
No Virtual Flow Meter
Physical flowmeters are expensive and unreliable on wells. Without VFM, production optimization is impossible — operators do not know real-time flow rates.
Pipeline Leaks
Traditional threshold systems detect only major leaks. Micro-leaks from 0.3% of flow and slow corrosion remain invisible for months.
No Data for Optimization
VFD frequency, pump jack stroke rate, and chemical dosing decisions are made without data. Missed savings: up to 15% on electricity alone.
4 Levels of ROSSMA Intelligent Analytics
From basic telemetry to ML prediction — each level adds intelligence to your data
4-Level Analytics
Level 1: basic telemetry, trends, threshold alarms. Level 2: well model and VFM. Level 3: full diagnostics (ASPO, gas slugs, leaks, sand). Level 4: ML-powered RUL prediction and regime optimization.
VFM — Virtual Flow Meter
Well flow rate calculation without a physical flowmeter. ESP accuracy ±5-15% (similarity laws, energy balance, pump curves). SRP accuracy ±12-25% (Gibbs method). Graceful degradation — works with any available sensor set.
21 Diagnostic Widgets
Pump and motor health score 0-100. ASPO index, gas slug detection, sand production, axial load, thrust bearing, power quality (THD, phase imbalance), energy efficiency, RUL prediction.
Decision Fusion for Pipelines
4 leak detection methods: NPW localization (±50 m, <60 sec), AI/ML Isolation Forest, hydraulic gradient, material balance. Less than 5% false positives.
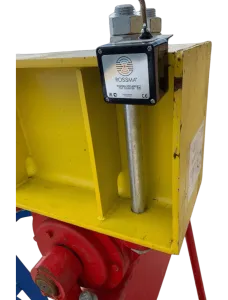
Wireless Ex-Certified Sensors
ROSSMA IIOT-AMS: vibration, temperature, pressure, flow, gas analysis. LoRaWAN up to 15 km, battery up to 10 years. ATEX / TR CU 012/2011 Zone 0-1-2. Stainless steel IP67, -55 to +85 °C.
ROSSMA NETS HMI — ISA-101 SCADA
16 screens: P&ID mimics, trends, ISA-18.2 alarms (5 levels), 9 report types (Excel/PDF). Web interface with 3 themes. From 1 well pad to entire field (50-200+ devices).
Architecture: From Sensor to RUL Prediction
4 analytics levels — each adds intelligence to your data


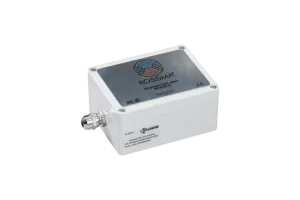
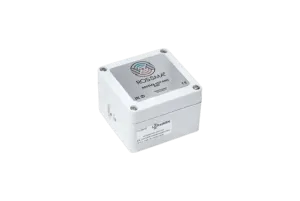
Predictive Maintenance Equipment
Ex-rated vibration, temperature, pressure sensors and specialized devices
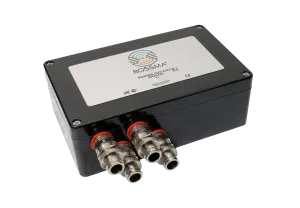
Autonomous Measuring and Switching Device ROSSMA® IIOT-AMS ANALOG Ex X4
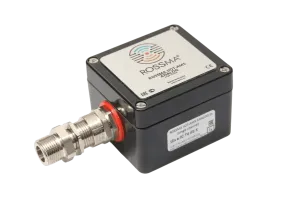
Autonomous Measuring and Switching Device ROSSMA® IIOT-AMS ANALOG Ex Single Channel
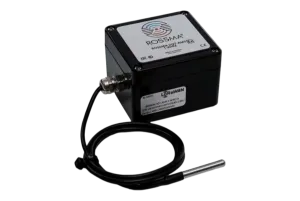
Autonomous Switching Device ROSSMA® IIOT-AMS 1-Wire Ex (Temperature Sensor)
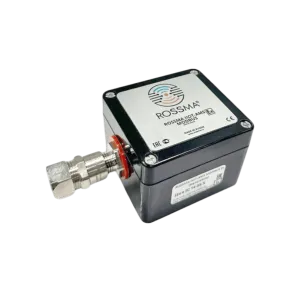
Measuring and Switching Device ROSSMA® IIOT-AMS MODBUS Ex Stand Alone
Switching Device ROSSMA® IIOT-AMS Modbus
Autonomous Measuring and Switching Device ROSSMA® IIOT-AMS TILT COUNTER Ex (Tilt Counter)
Autonomous Switching Device ROSSMA® IIOT-AMS ESD (Equipment Security Device)
Economics: Reactive vs Scheduled vs Predictive
ROSSMA predictive maintenance delivers the lowest total cost of ownership
| Parameter | Reactive | Scheduled (PM) | Predictive (ROSSMA) |
|---|---|---|---|
| Strategy | Fix on failure | Calendar-based | Condition-based (CBM) |
| Failure prediction | None | None | 30–90 days (ML) |
| Repair cost | 3–5x planned | Planned cost | Minimal (early replacement) |
| Downtime | Maximum | Medium (over-maintenance) | Minimal |
| Virtual flow meter | None | None | VFM ±5–15% |
| ASPO / gas / sand | At breakdown | At breakdown | Early diagnostics |
Key Economic Advantages
Frequently Asked Questions
What is 4-level analytics?
How does VFM work without a physical flowmeter?
What is Decision Fusion for pipelines?
What equipment can be monitored?
Do sensors work in hazardous areas?
How far in advance are failures predicted?
What are the 21 analytics widgets?
What is the implementation cost?
Ready for Predictive Analytics?
Get a system quote with VFM, RUL prediction, and Decision Fusion for your facility — from one well pad to an entire field